Image Credit: NASA/Goddard/Conceptual Image Lab
The physics in our near-Earth space depends heavily on the persistent flow of plasma from the Sun known as the solar wind. This plasma flow may be characterized in many different ways, e.g. how fast it moves, the number density of ions it brings, and the magnetic field it carries. Each of these factors may impact the magnetosphere-ionosphere-thermosphere system.
By combining the velocity and density of the solar wind, the pressure may be determined. Sometimes, rapid increases in solar wind dynamic pressure are observed. The origin of such an increase may be a coronal mass ejection from the Sun. In any case, this phenomenon of a rapid pressure increase in the solar wind may result in perturbations in the Earth’s magnetic field.
In a paper by Madelaire et al. [2022] entitled “Geomagnetic Response to Rapid Increases in Solar Wind Dynamic Pressure: Event Detection and Large Scale Response“, they perform a statistical analysis using 3,867 events when a rapid increase in solar wind dynamic pressure have been observed. This includes a method for detecting such discontinuities in the solar wind data by using the random forest machine learning algorithm. Compared with similar earlier studies, the technique by Madelaire et al. [2022] allow them to determine much more accurately when the rapid increase in pressure occur, which is crucial to resolve the effects on the Earth’s magnetic field.
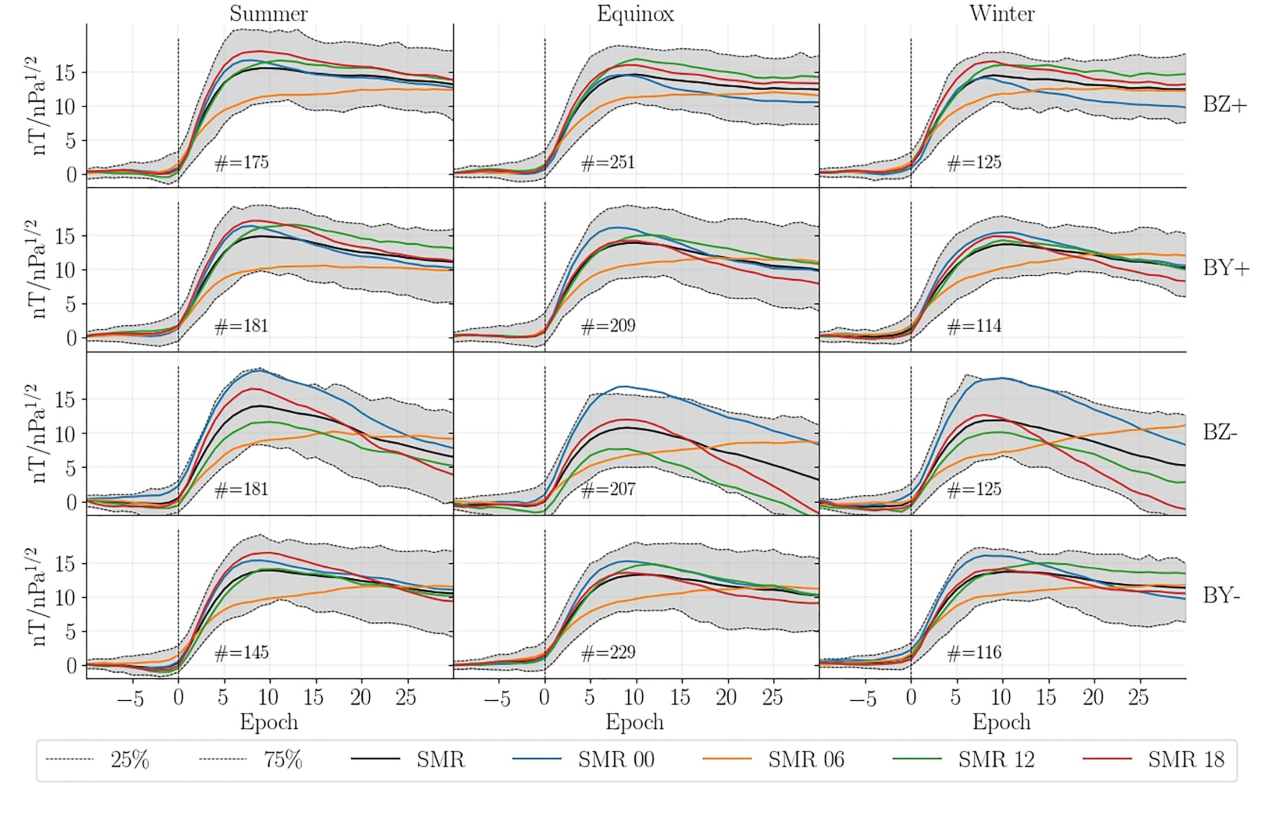
The results show that the magnetic perturbation tends to be weaker on the morning side of the Earth compared to the afternoon side, probably due to an asymmetry in the ring current flowing inside the magnetosphere. In any case, the results also reveal a complex geomagnetic response, demonstrating a need for further statistical analyses.

The image above is Figure 9 from Madelaire et al. [2022], showing average magnetic field perturbations on the ground when there is a sudden rapid increase in the solar wind pressure. The results reveal that the reponse varies for different times during a day. While most of the curves are similar in trend, we note a different behaviour by the orange curve, representing the results from sunrise (dawn).


